Did you also lose your vehicle after 2000 in San Francisco?
In today’s post, we’ll look at how vehicle theft incidents in San Francisco have evolved over the years from 2003 to 2018. We found this to be an interesting case worth looking into. Below we have provided some visualizations that make it easier to catch the curious insights and patterns. We invite you to read this post!
Dataset Used
We used a public dataset that provides us with knowledge about the number of occurrences of various crimes in San Francisco neighborhoods. It can be used to find out how many crimes of a given category were committed, when, and in which of the city’s 10 districts. You can access the data at this link.
Brief Overview of Vehicle Thefts over the Period
As a starting point, we present you with a heatmap that shows the intensity of vehicle theft incidents in each San Francisco neighborhood for each month from 2003 to 2018. You can see it through 10 data points in the animated visualization. Feel free to interact with the map by adjusting the speed at which it plays and selecting a specific month to see the intensity of vehicle thefts for that month for the city’s neighborhoods.
We think you’ve noticed that vehicle thefts in each district have decreased by more than two times since 2006. Perhaps this is due to intensified road controls implemented since then or new legal regulations.
Vehicle Thefts by Year over the Period
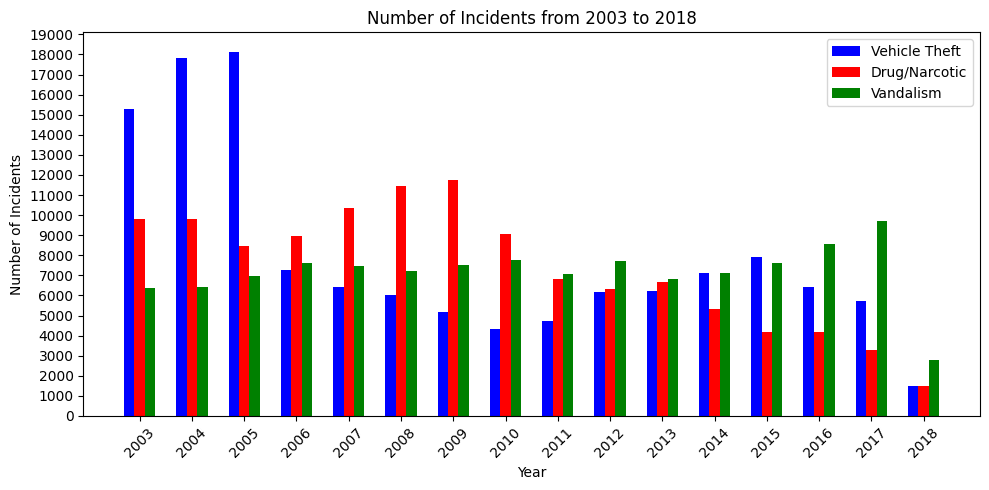
If you haven’t caught on by now, the visualization below clearly shows the drastic decline in vehicle thefts since 2006. To diversify the context and provide comparison on the chart, we’ve also included values for recorded incidents of drug/narcotic contact and acts of vandalism.

We observed an annual increase of approximately 1,000 drug/narcotic contact incidents from 2005 to 2009. However, since 2010, there has been a significant downward trend in the number of these incidents. On the other hand, incidents of vandalism remained relatively consistent, hovering around an average of 7,000 from 2003 to 2013, with minor fluctuations. Between 2014 and 2017, there was an increase in vandalism incidents, followed by a more than threefold decrease in 2018 (which is mainly due to the fact that the dataset only goes back to May 2018).
In our opinion, the period from 2006 to 2010 deserves attention. During this time, the number of incidents involving drug/narcotic contact shows an upward trend (with only a decrease from 2009 to 2010), while the number of vehicle theft incidents decreases. As mentioned earlier, the number of vandalism incidents remains relatively stable. Therefore, our speculation is that perhaps some vehicle thieves gradually shifted towards drug/narcotic activities.
How street crimes have developed over the years
To understand the development even more, ‘Vehicle Theft’, is compared with multiple street crimes over the years. Thereby, we can state that both ‘vandalism’ and ‘sex offenses, forcible’ have slightly increased over the years, whereas the other focus crimes have decreased. To get the full experience and comparison, choose how you will display the data and what crime(s) you will compare on a yearly basis.
The decrease in crime rates are due to efforts by law enforcement and Mayor Breed’s initiatives. Among other things, by prioritizing enforcement against property crime, implementing a zero-tolerance policy for drug-related activities, and invested in bolstering police staffing to ensure the ressources to serve the community and protect its residents1.
Prostitution has decreased due to programs like First Offender Prostitution Program, which focuses on reducing the demand rather than targeting prostituted individuals. By educating “Johns”, arrested men for soliciting prostitutes, about the negative consequenses of prostitution, they agree to pay a fee and attend to a one-day workshop at “John School” and have the charges dropped if they avoid another re-arrest for a year after the class2.
Conclusion
In today’s post, you learned about the trend of recorded vehicle theft incidents from 2003 to 2018. On the heatmap, you could observe the fluctuating intensity of vehicle thefts across all districts of San Francisco during this period. Additionally, through Bokeh visualization, you also gained insight into the situation regarding other street crimes like drug/narcotic incidents and vandalism.
We hope we’ve also encouraged you to explore various datasets and conduct your own data analysis. Follow our blog for more - until next time.